Role
Researcher,
UX/UI designer,
Usability Test, Competitors analisys
Tools
Team
Camilla Indelicato
Timeline
8 weeks
Sept - Dec 2022
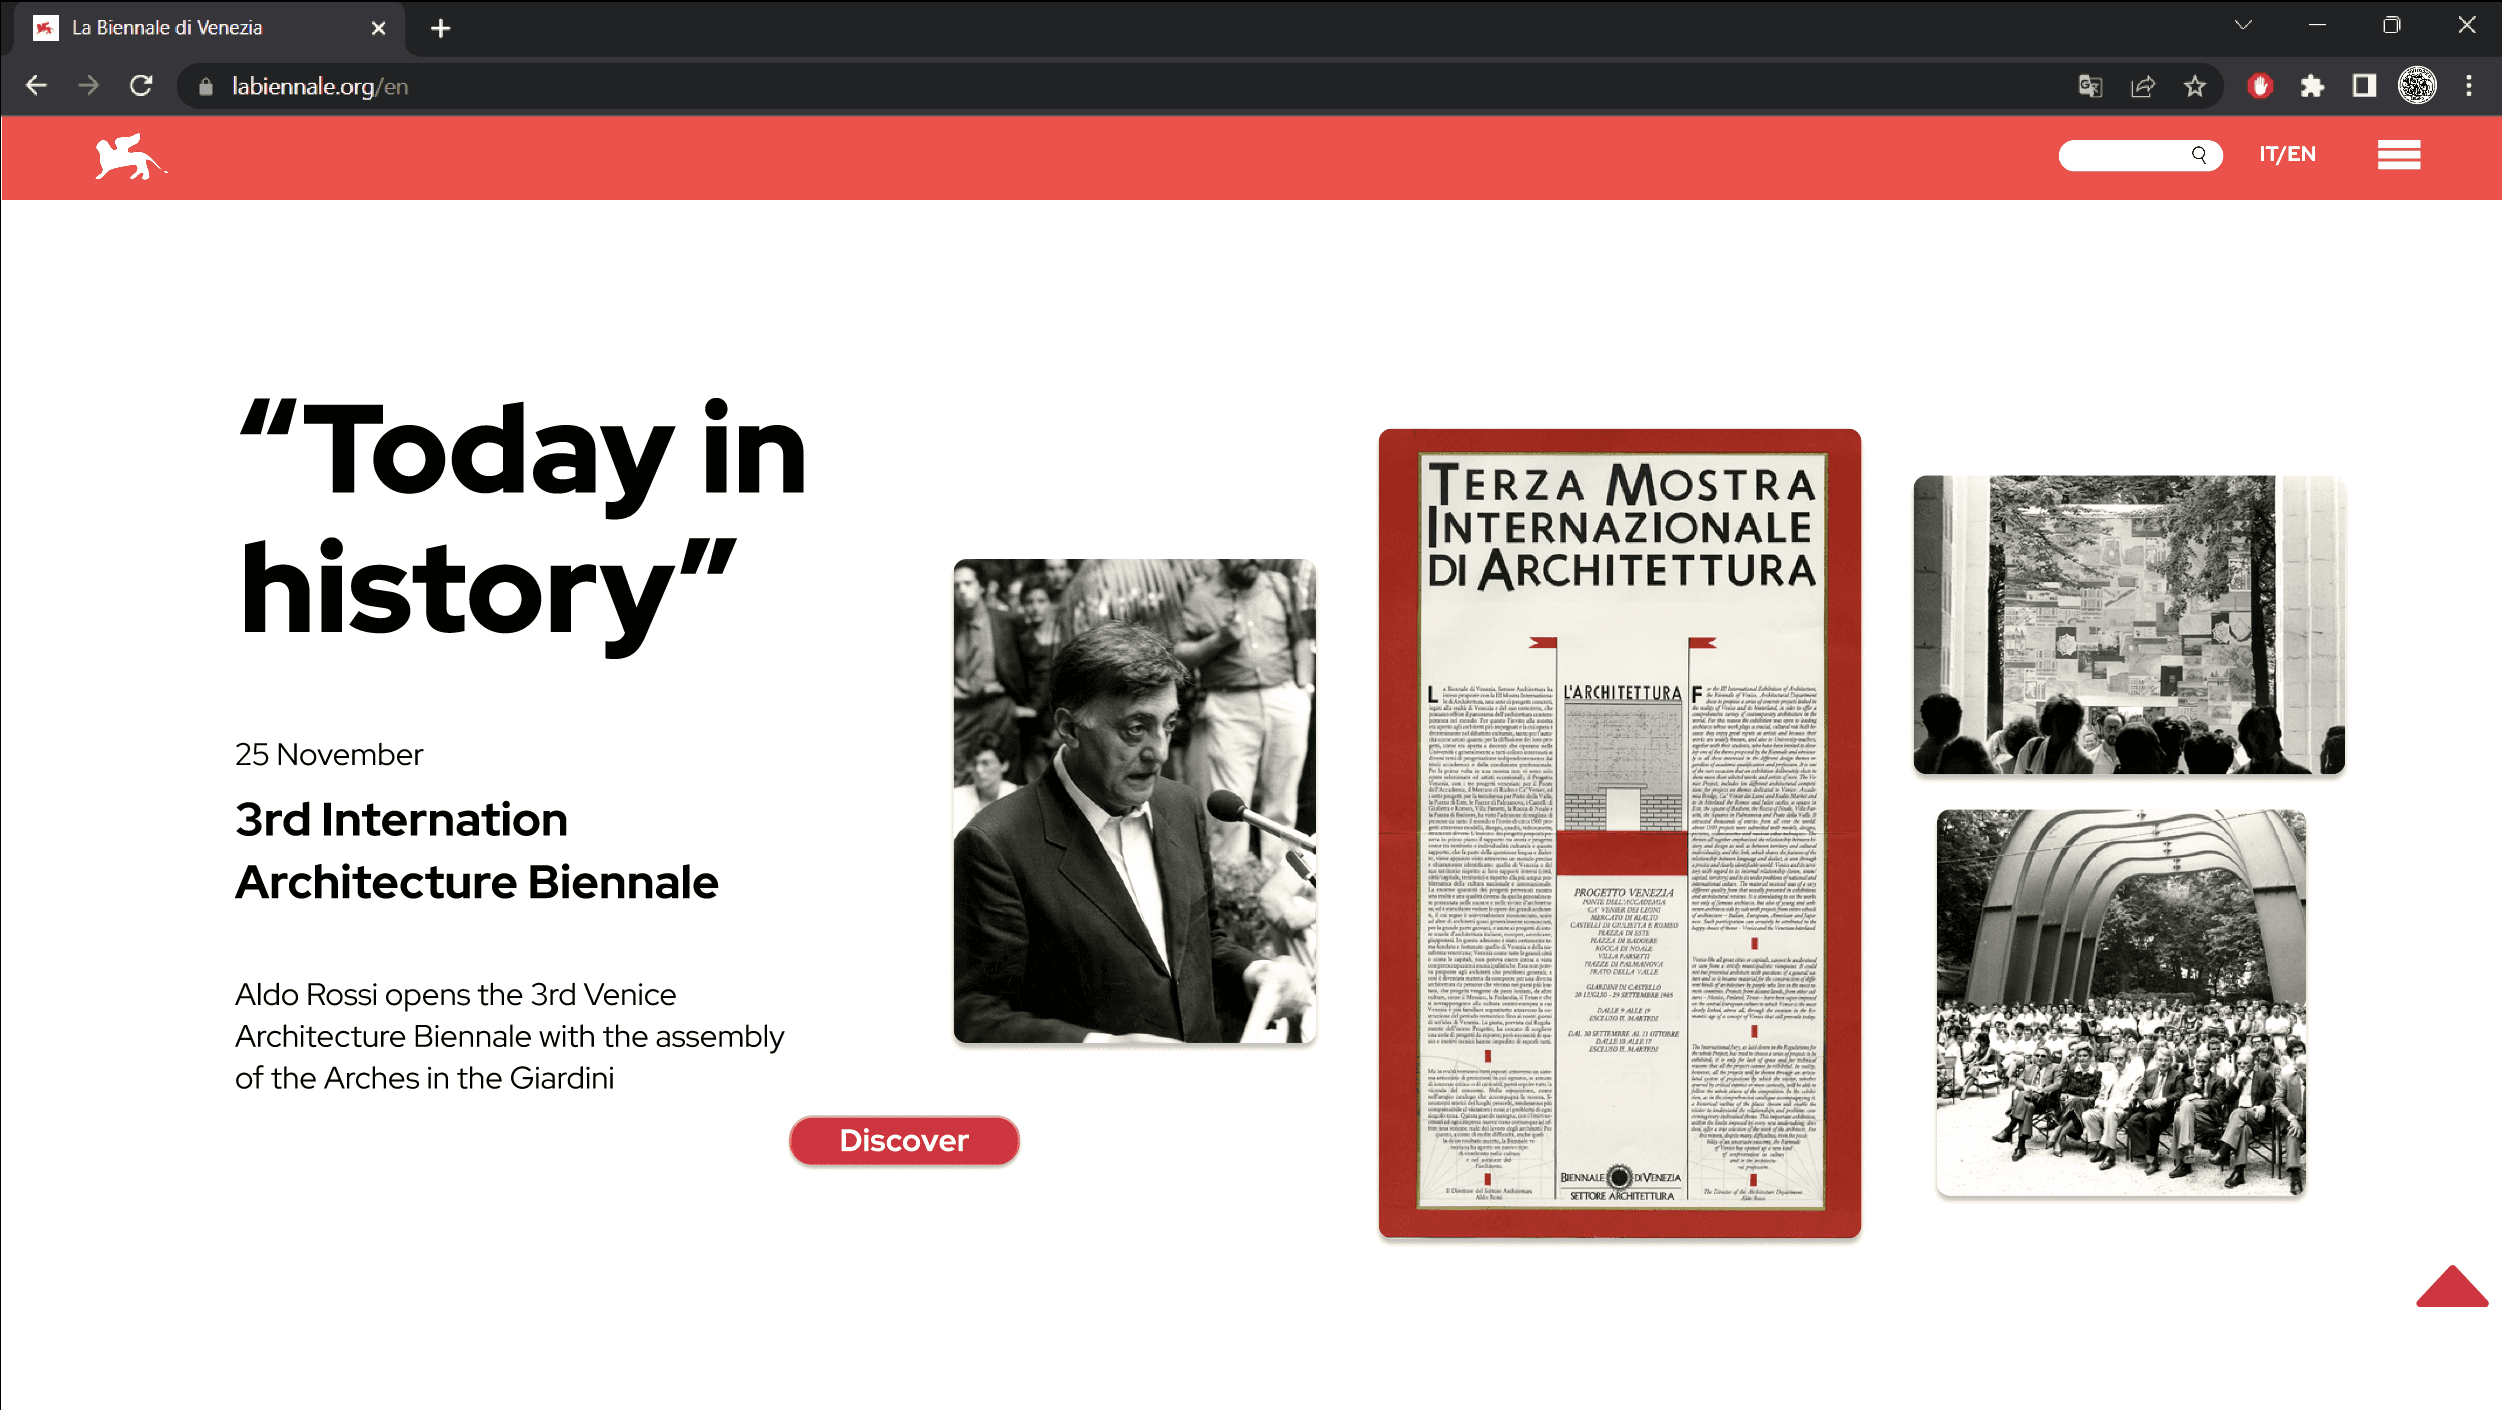
La Biennale website comprises five distinct sections dedicated to art and architecture, featuring biennial exhibitions that alternate periodically. Additionally, there are sections for theater and music, which highlight upcoming performances, and a cinema section hosting the renowned Venice Film Festival.
request
The project aims to redesign a site that does not excel in functionality and usability.
Please take note this project was made in 2022, the Biennale Website was not as the one today.
challenge
The current Biennale website suffers from a lack of clarity, structure, and usability. Poor information architecture and an inconsistent design system make navigation confusing, while key content is either missing or difficult to locate. The ticketing process is inefficient and unclear, and the homepage fails to communicate the full scope of the event—limiting user understanding and engagement. Overall, the site was not user-friendly and does not effectively meet user needs.
process
The project focused on rethinking the structure and experience of the Biennale website through a series of strategic design steps. The information architecture was improved to ensure clearer content organization and easier access to key information. We redesigned the user flow to create a more intuitive and seamless navigation experience. Usability metrics were applied throughout the process to guide decisions and validate improvements. A new layout was developed to enhance readability and visual hierarchy, while navigation elements were redesigned for better accessibility and consistency. Overall, the goal was to make the website more modern, engaging, and aligned with user expectations.
Project Steps
01
Research
Interviews
Personas
Empathy map
Task matrix
02
Website analysis
Task user-flow
Usability Chart
Competitors Chart
03
Re Design
New IA
Task user flow
Home Page
New Page
Content update
04
Design System
Design system
Templates
Prototyping
05
User Testing
Testing
Improvements
Research
4 partecipant, 12 questions
Through semi-structured interviews with 6 different types of visitors to the biennial or similar cultural venues to begin our research of needs and wants.

Monica, 25
design student
Core needs
exhibition information,
cheap tickets
purchase habit
prefers to buy tickets when browsing exhibition information online, like to buy early bird tickets

Edoardo, 24
videomaker
Core needs
buy the subscription,
detailed program of events
purchase habit
online in advance
Frustation to find Feltival ticket

Xin Zhang, 31
traveler

Rosanna, 60
E. school teacher
core needs
Booking in advance, tour guide, infos
about time and cost
purchase habit
Usually book in advance but sometimes pay offline (needs to collect student money)
Research
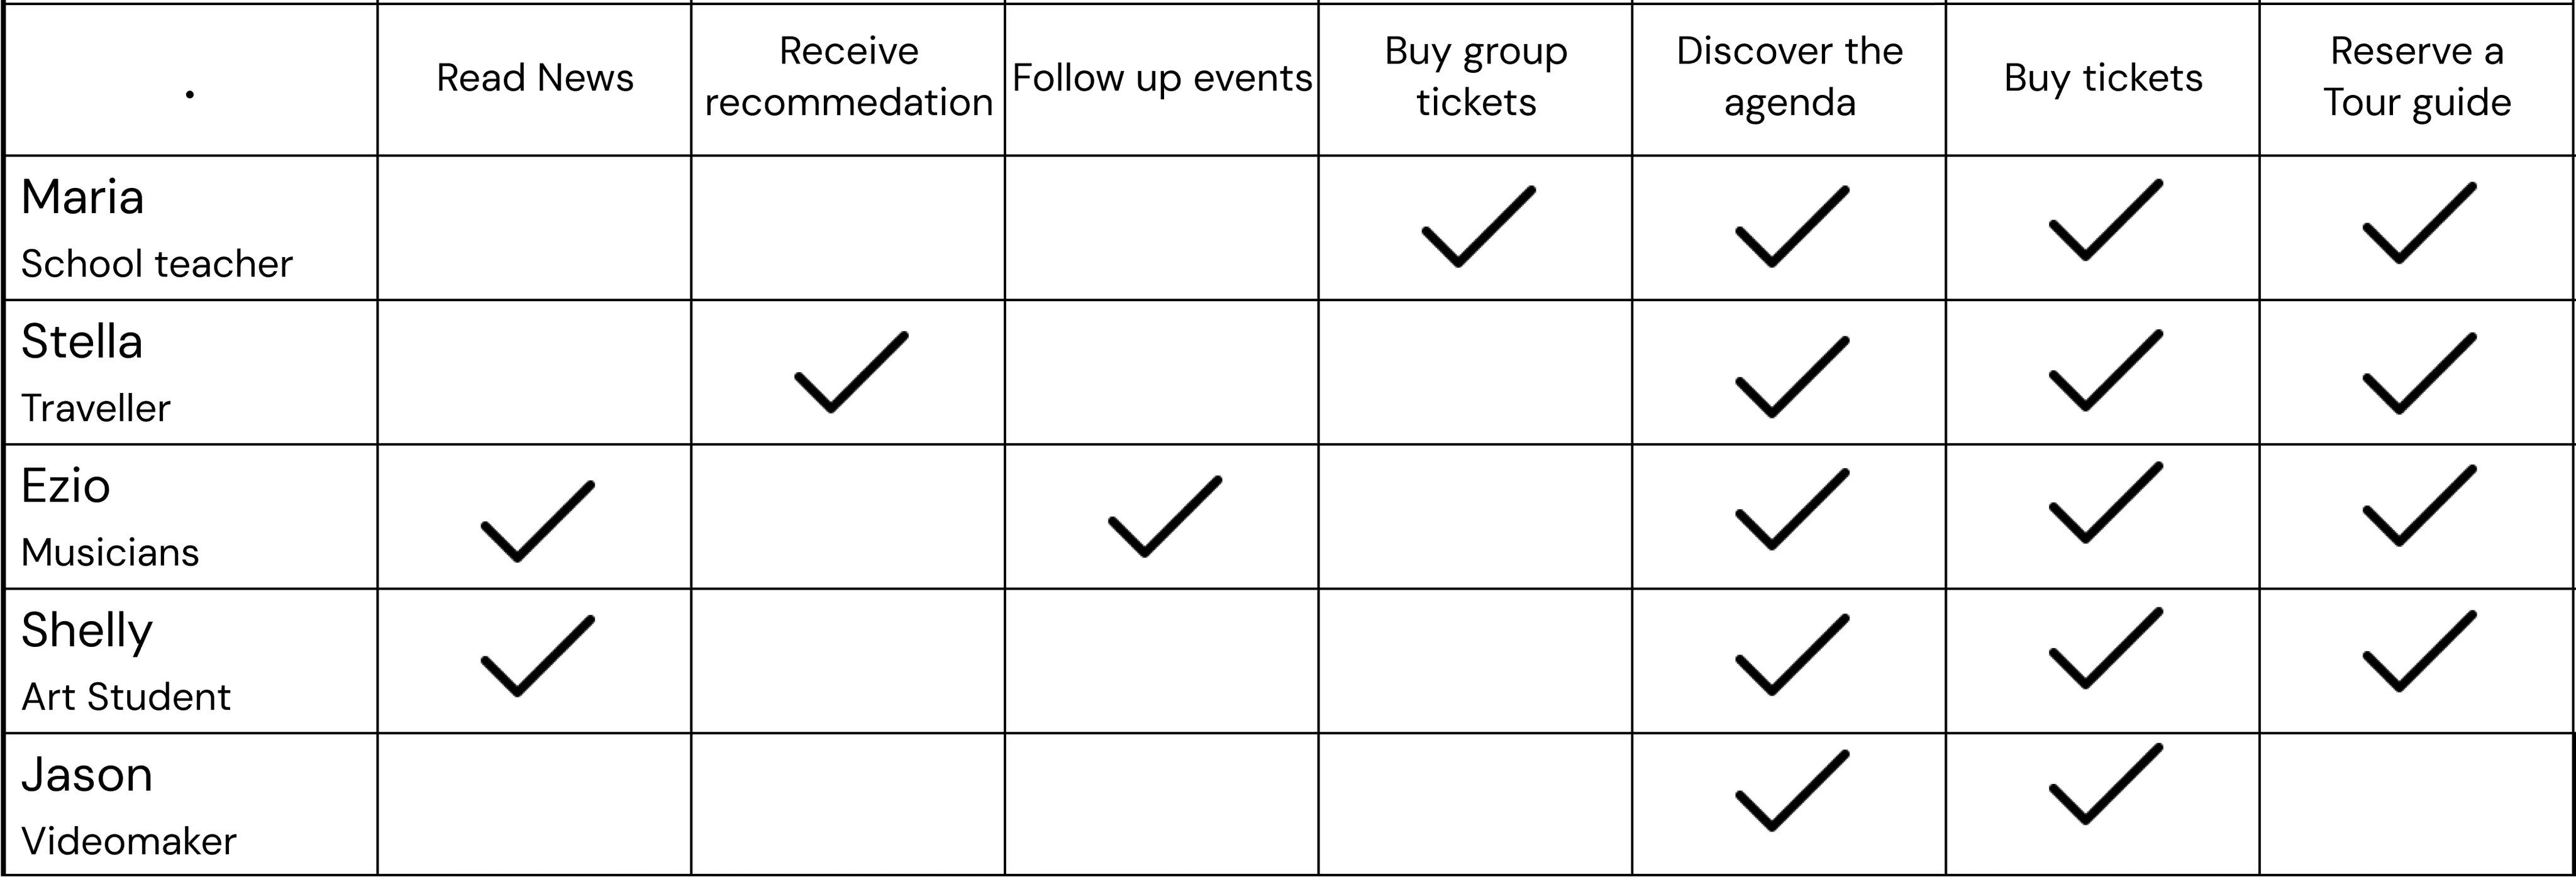
Personas, empathy map & Task Matrix
The creation of five personas and respective empathy maps allowed us to trace the main tasks and processes that take place within the site and that we want to take into analysis. Using personas, we identified the main tasks, goals, core needs, and frustrations experienced by users when interacting with the product. Empathy maps delve further into their thoughts and emotions, defining both pain points and benefits associated with the Biennale website.


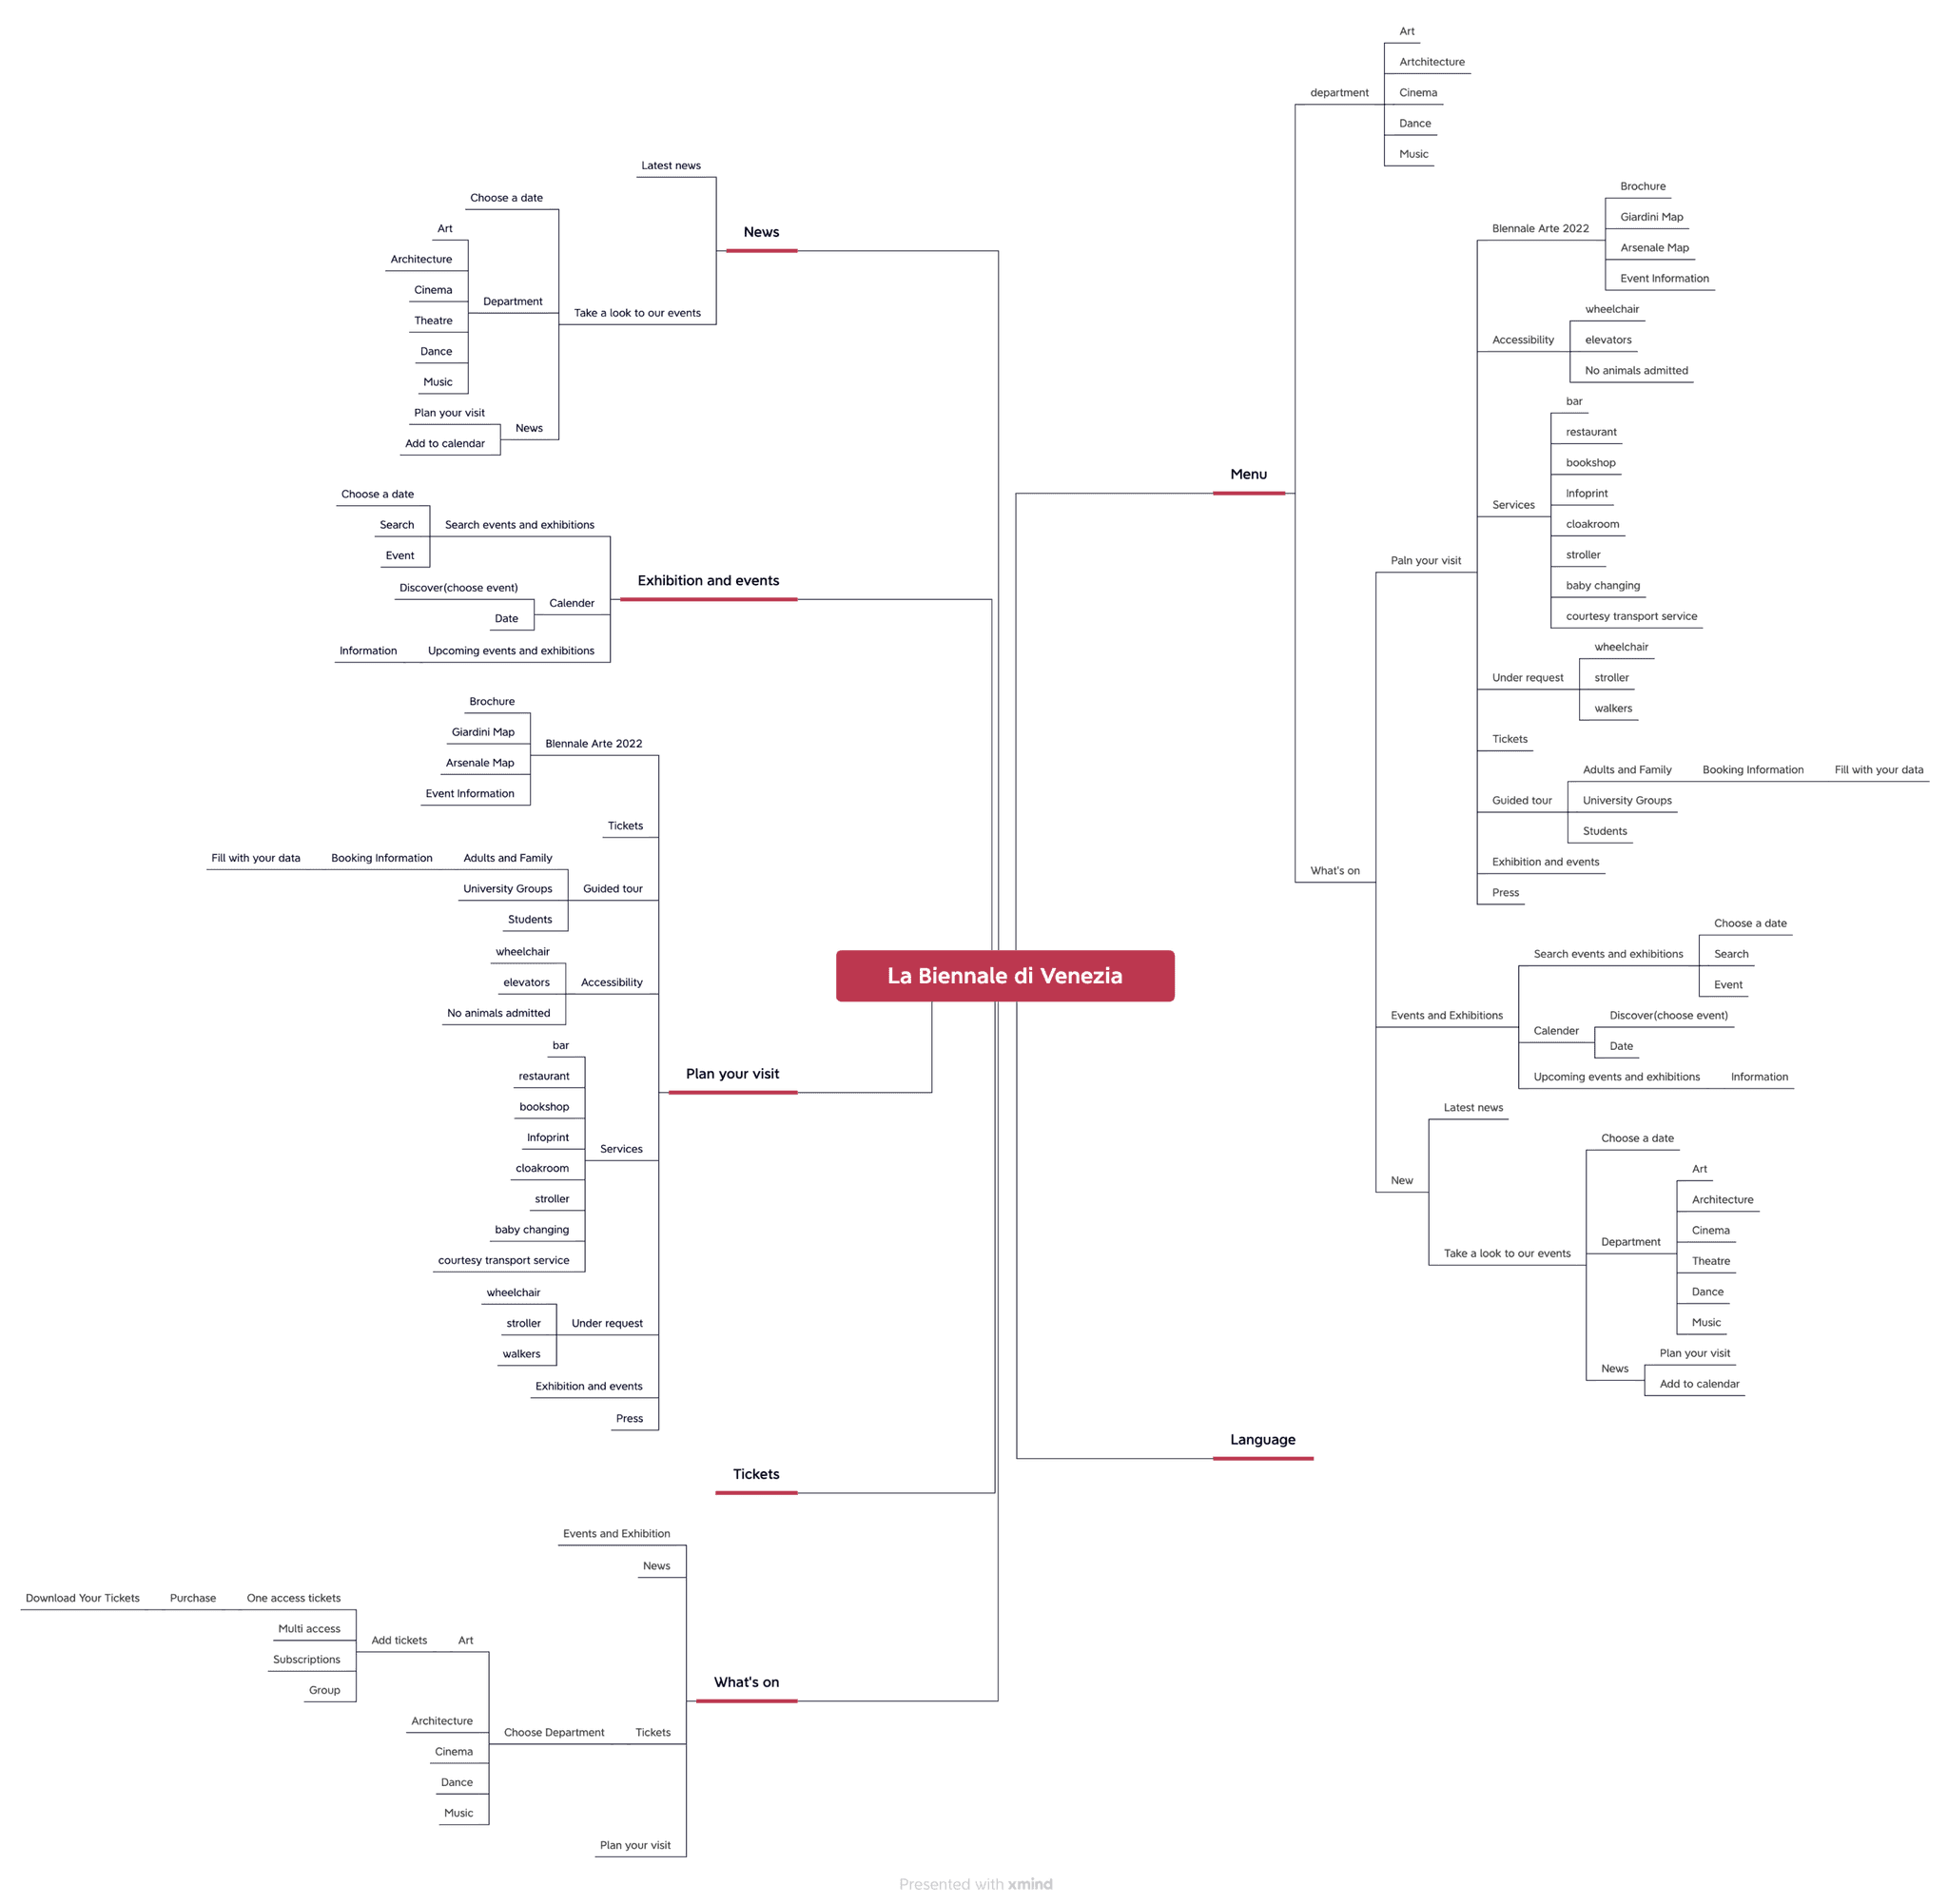
Website analysis
IA Analysis
Website analysis
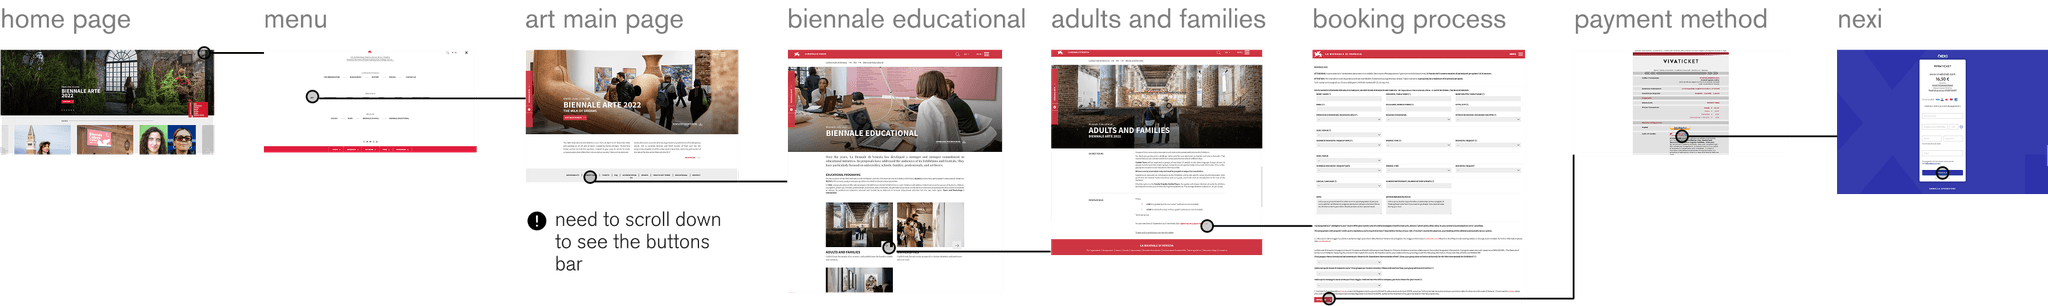
4 user flow analysis
By utilizing a task matrix to compare the needs and desires of users, we identified the four main tasks. Subsequently, we conducted a detailed analysis to determine the number of pages and clicks required to complete each process.
Apart from layout problems with horizontal pages, we noticed issues with excessive text, readability, and information accessibility. Navigation elements lack coherence, and some services are incorrectly placed on pages unsuitable for their purpose.
Ticket service
10
pages
8
clicks
Guided tour
10
pages
8
clicks
Website analysis
4 competitors
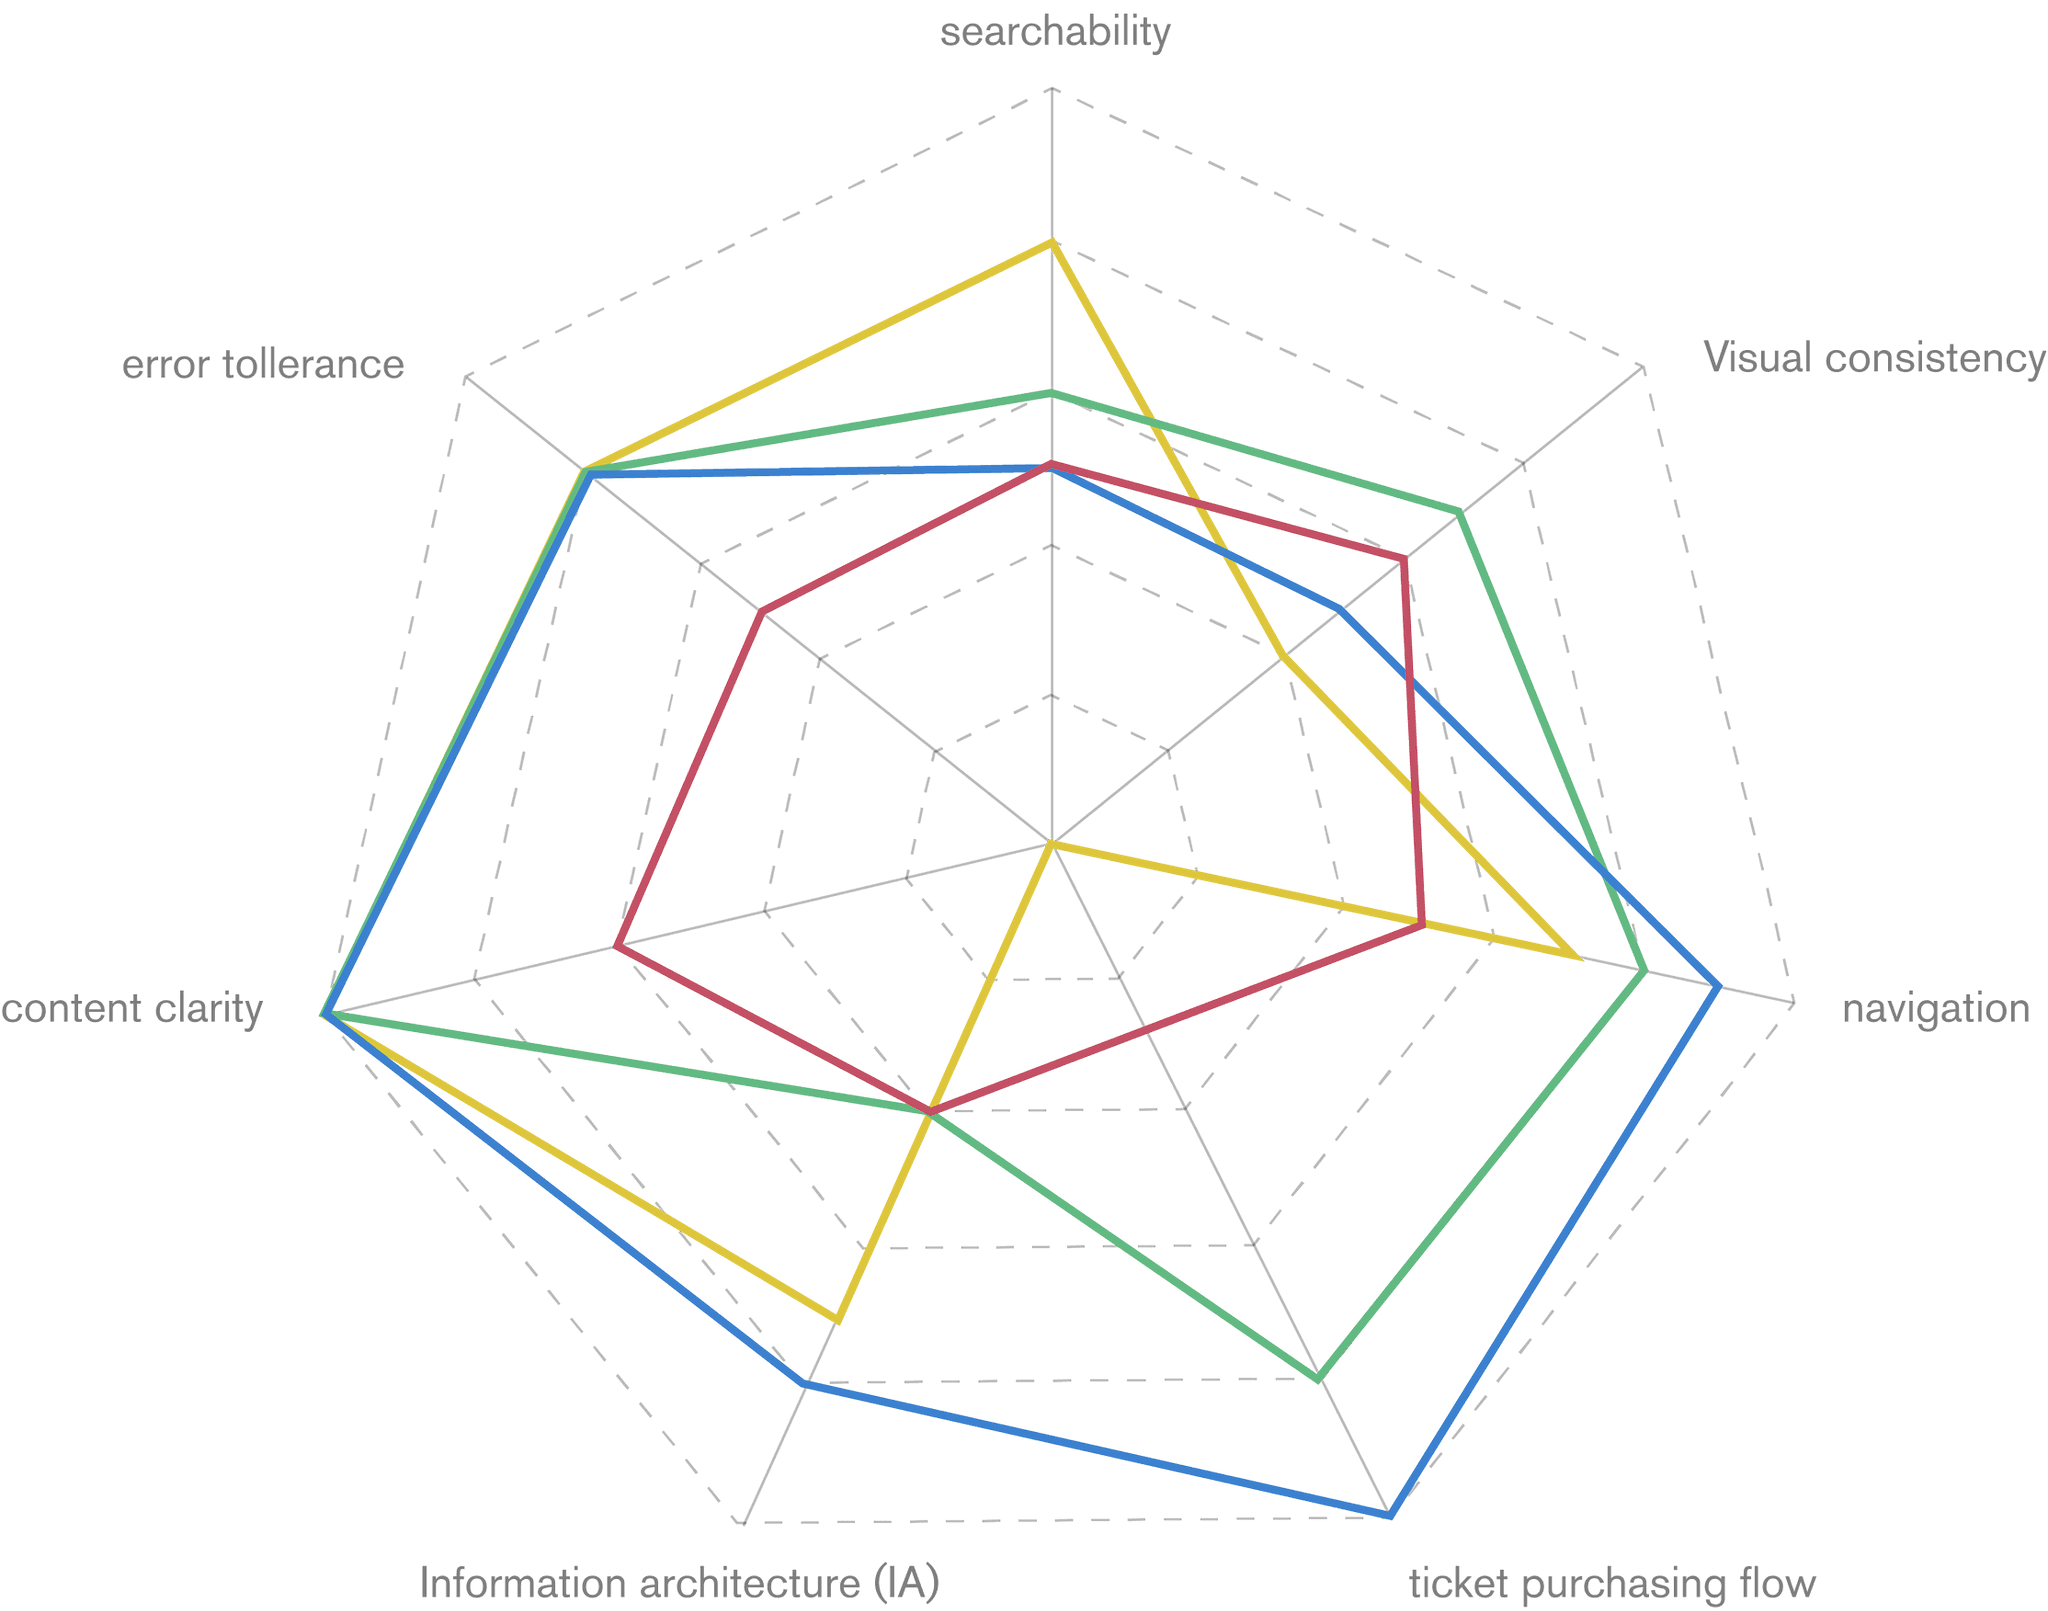
We also analyzed benchmarks to identify successful attributes, focusing on key tasks and their strengths throughout the process.
Subsequently, we analyzed them from a usability standpoint, considering factors such as searchability, graphic coherence, navigation, ease of ticket purchasing, information accessibility, content adequacy, and error tolerance. We created charts to compare these aspects.
Legend
La Biennale
Tate museum
Abbonamenti musei
Google Arts&Culture
searchability: Easiness to find infos and sections in the website; Viasual Consistency: Consistency of the design style among the different pages of the website and app; Navigation: Easiness and clearness to navigate the website; Ticket purchasing flow: Easiness to complete the task; Information Architecture (IA): Organization of contents in categories and subcategories; Content quality: Quantity and quality of the contents; Error Tollerance: Easiness to solve errors or to avoid them.
Re Design
Redesign Points
Rearrangement webpages architecture and flow
Services and flow have been simplified through a reduction of clicks and pages. They have become more functional and intuitive.
Redesign of visual elements and Design System
The visual elements have been highlighted and made more inclusive. Some functional elements have been added to improve the flow of the website and the error tolerance.
Simplification and management of contents
Selection of necessary contents for each website section presented in a more visual and readable manner and simplified to guarantee an immediate and clear information.
Website analysis
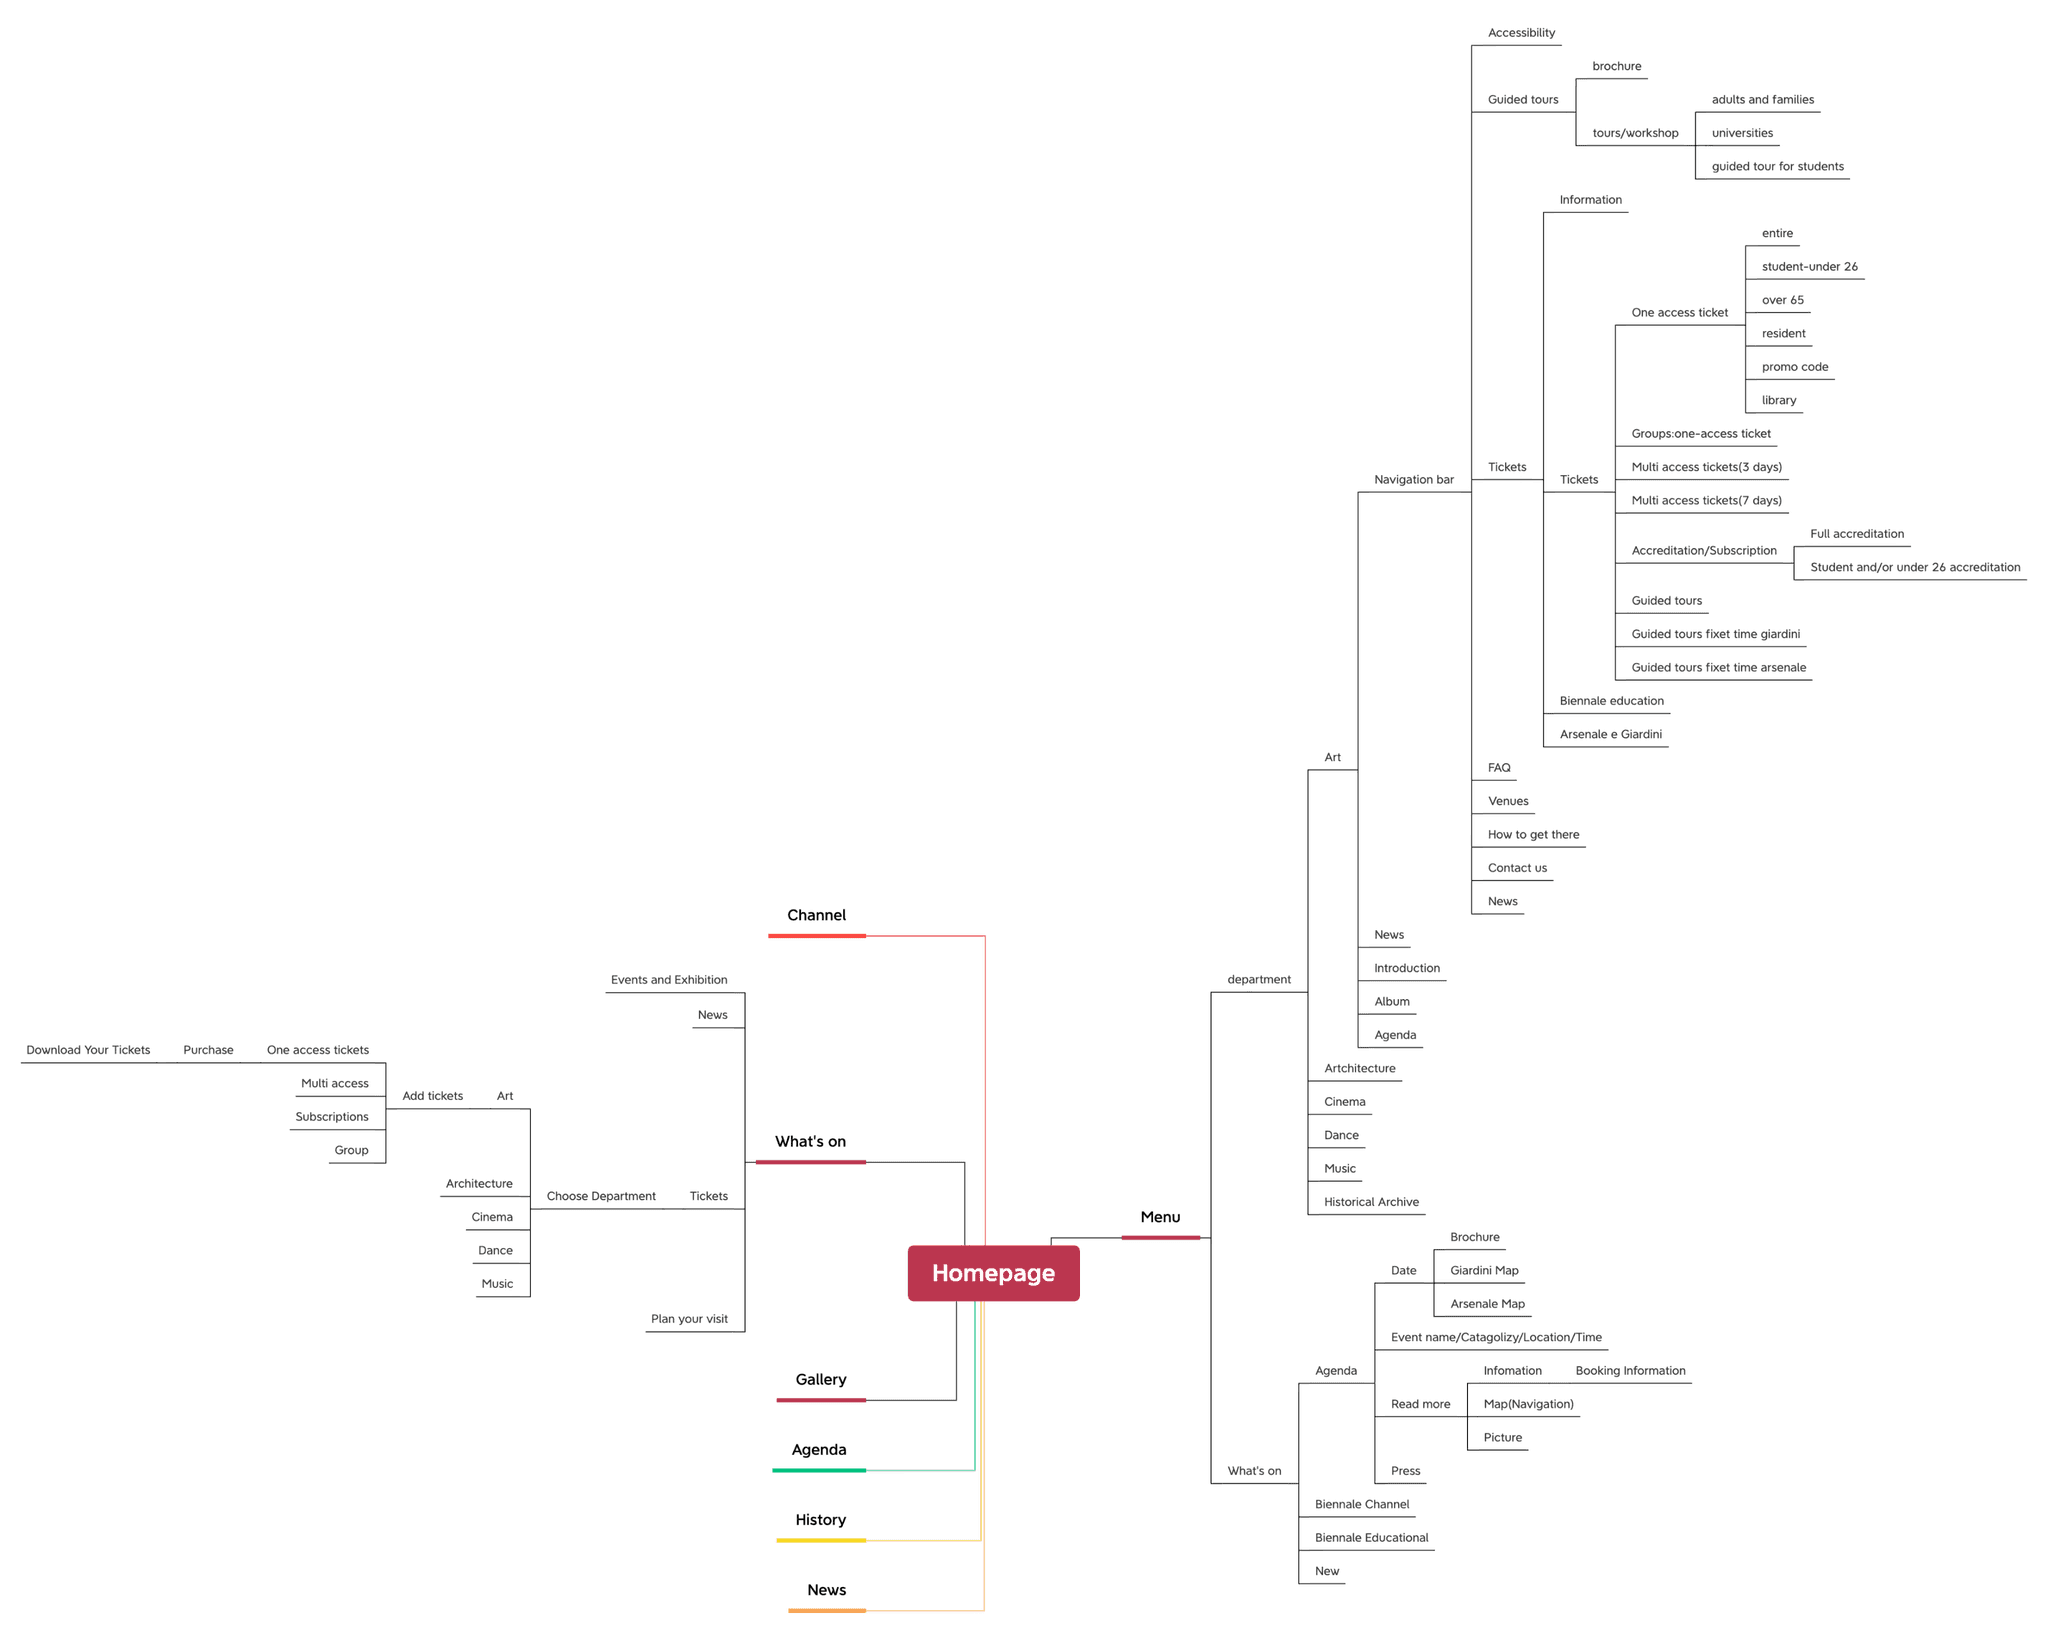
New Proposal IA
Re Design
Content and user flow re-design
Services and flow have been simplified, they have become more functional and intuitive. Selection of necessary contents and text for each section presented in a more visual and readable manner and simplified to guarantee an immediate and clear information.
We revamped the web page structure, simplifying and minimizing content while adding missing sections to improve user flow. Our redesigned information architecture ensures easy navigation and clarity, addressing previous confusion and misplaced content.
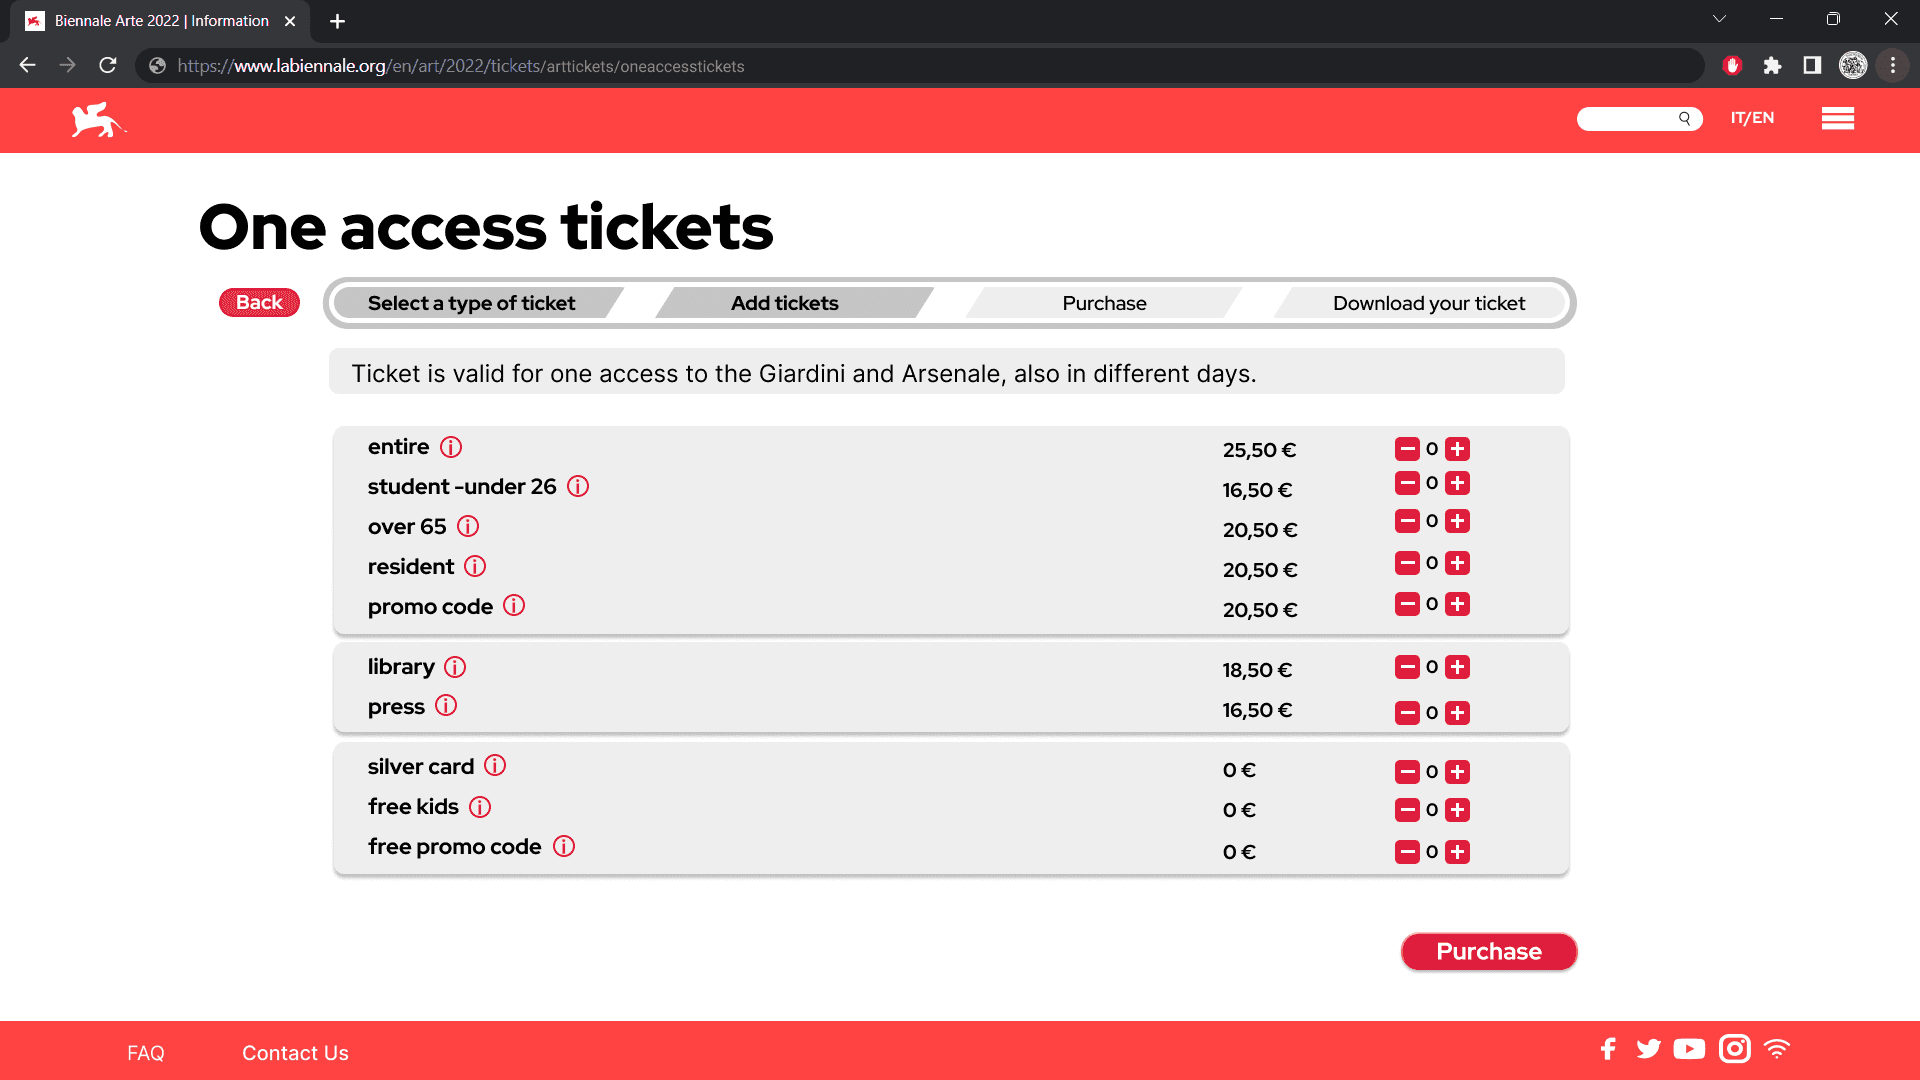
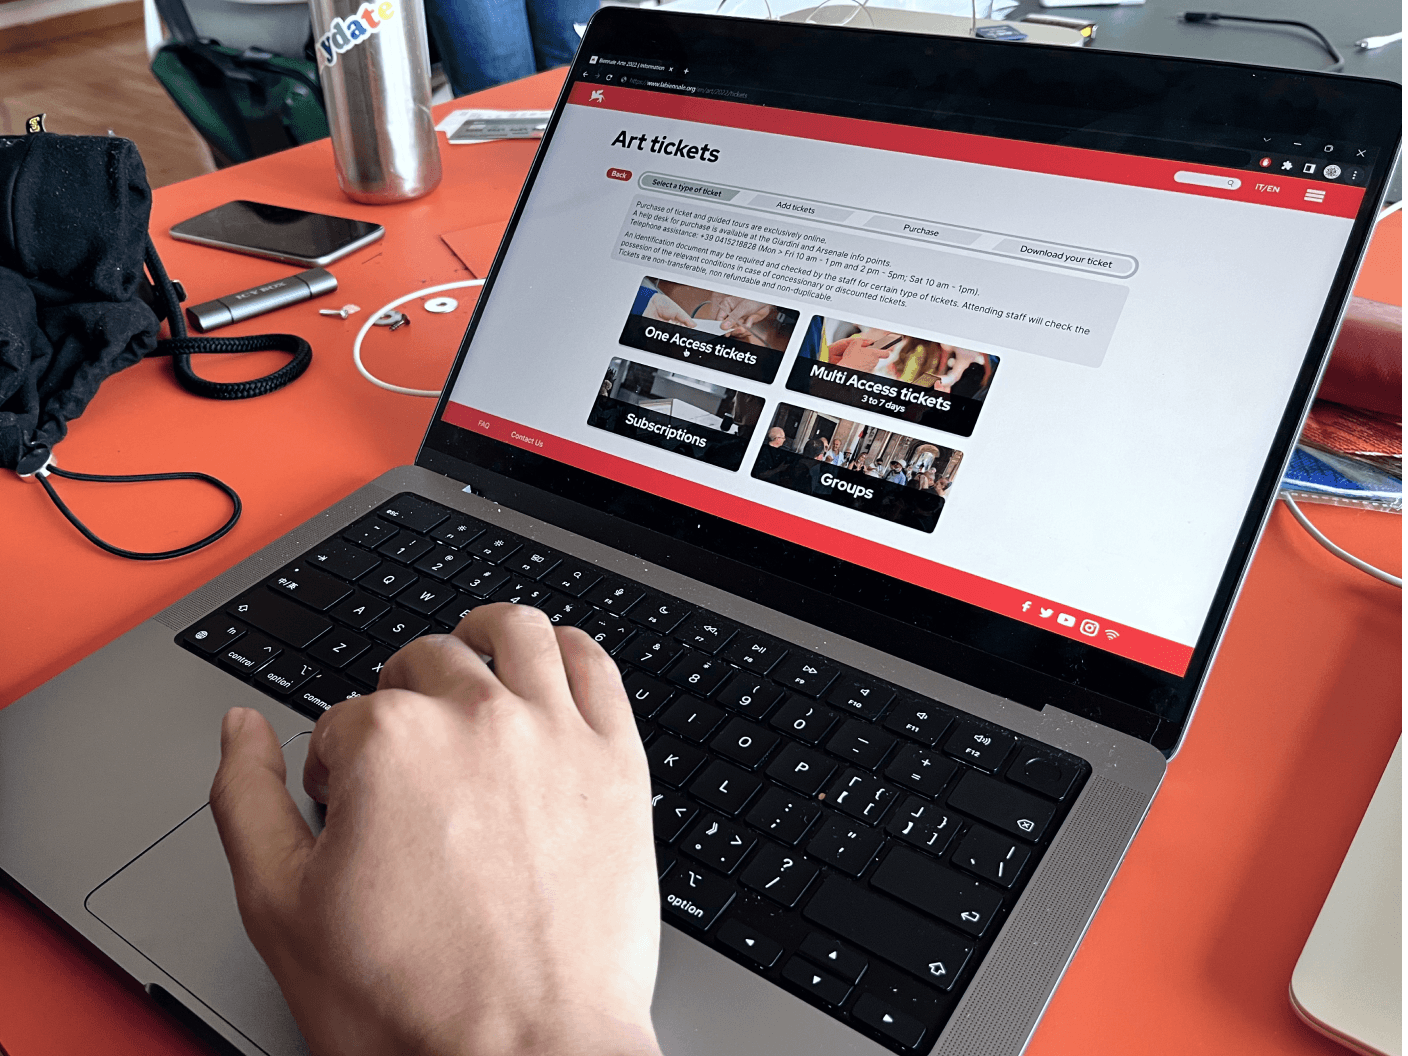
Ticket service
from
10
to
7
clicks
from
8
to
6
pages
Guided Tour
from
10
to
5
clicks
from
8
to
7
pages
Agenda
from
4
to
3
clicks
from
4
to
2
pages
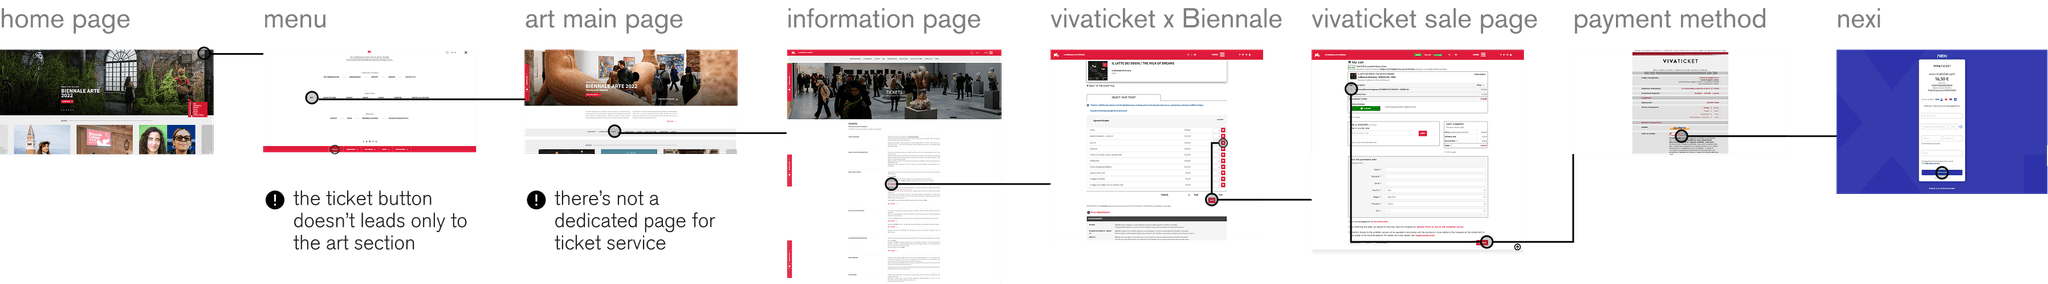
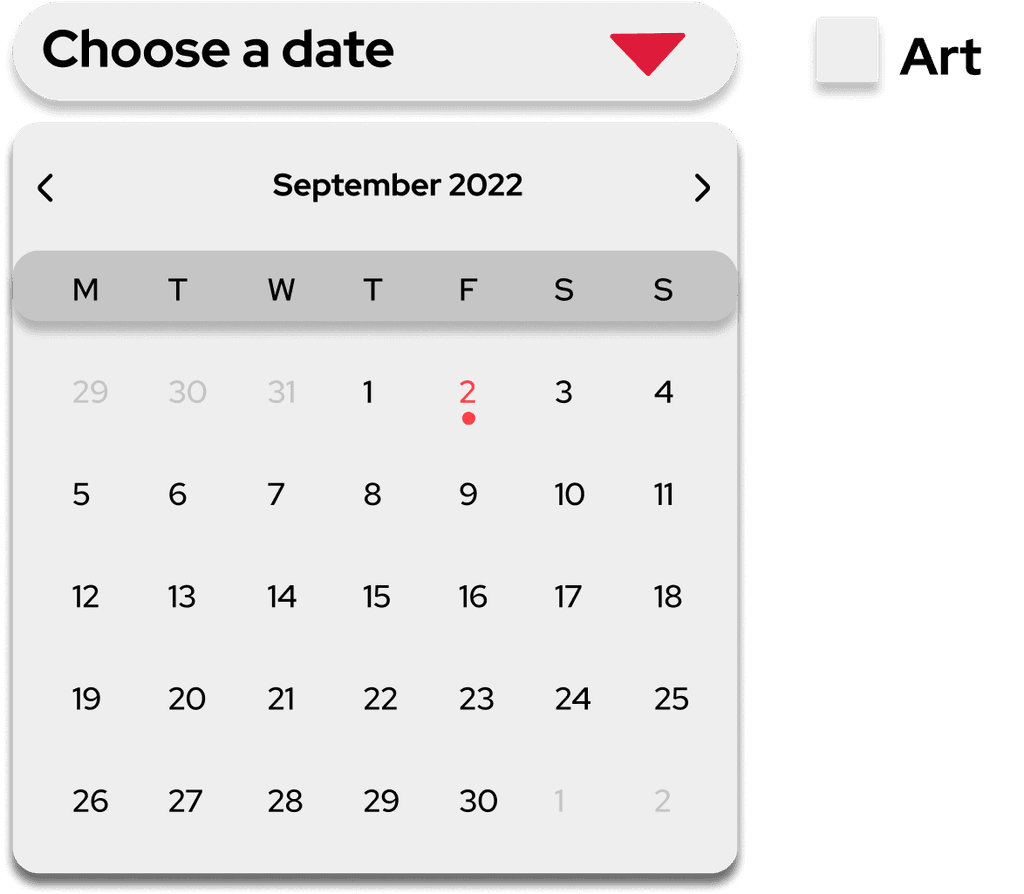
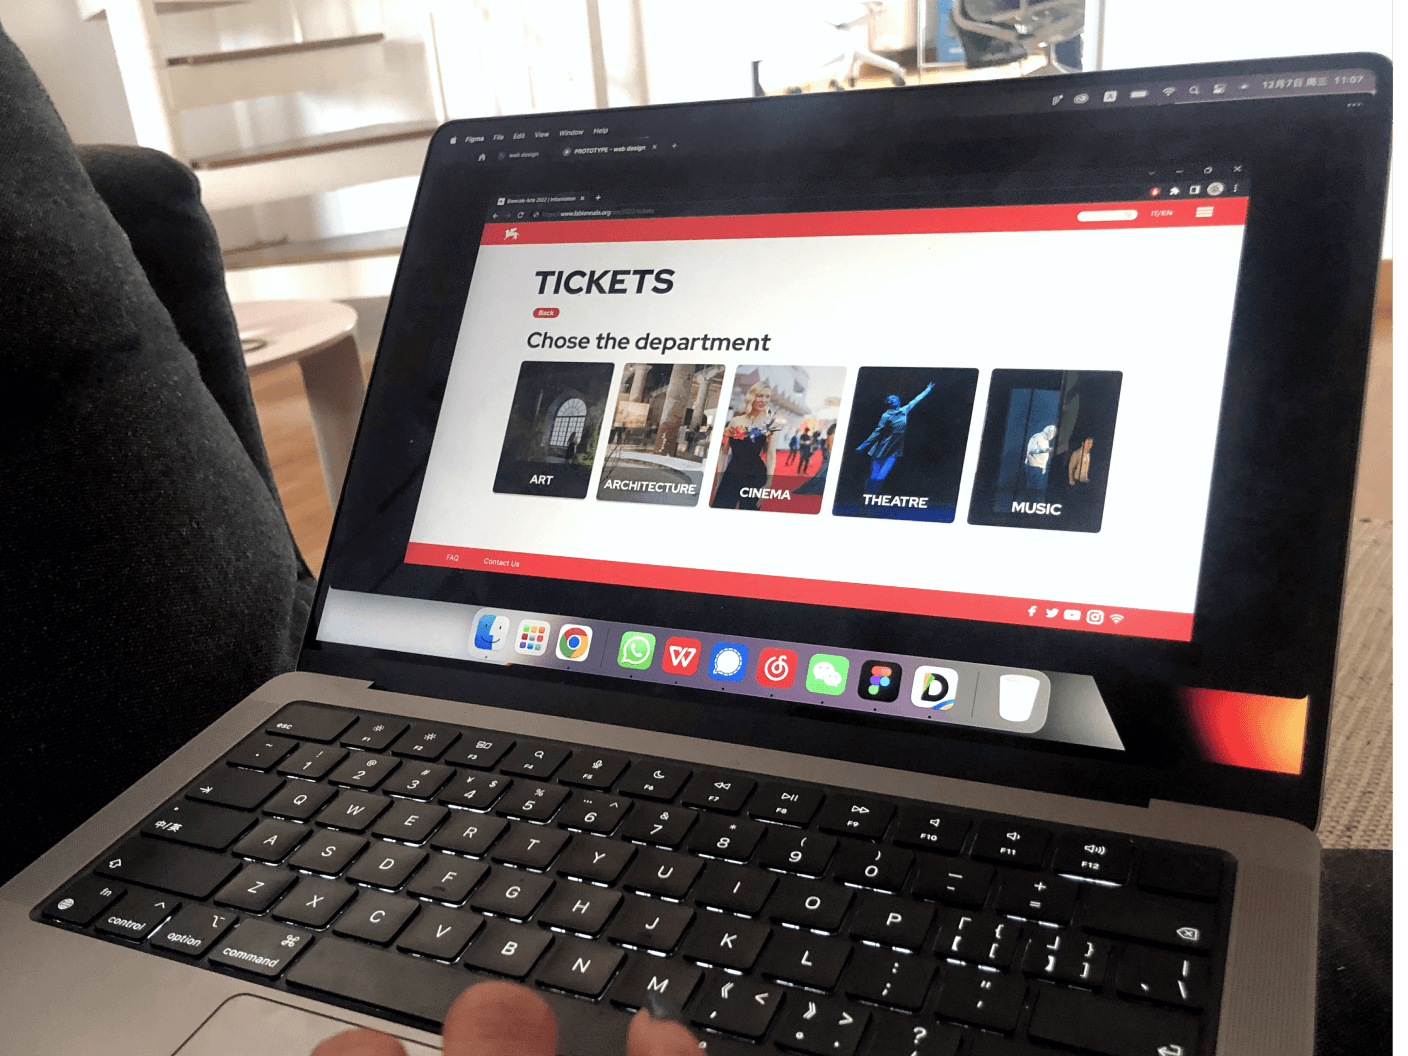
e.g ticket service improvement | Ticket selection page
Before
After
Re Design
e.g. Ticket Service user Flows
A completely new process has been designed for ticket service, drastically reducing the number of clicks and pages and making the information related to tickets and the purchase itself more accessible and simplified.
We've incorporated two new pages into our ticket service: a general ticket page and a conclusion page. Additionally, we've added convenient links to other sections, allowing users to seamlessly complete multiple actions, such as purchasing tickets and guided tours.

Re Design
New Pages: Home page, Plan your visit, Thank You page
The homepage redesign now reflects the diverse offerings beyond just art, showcasing various departments within La Biennale. We've introduced engaging interactive elements to captivate users and inspire them to explore further, enhancing their overall experience.
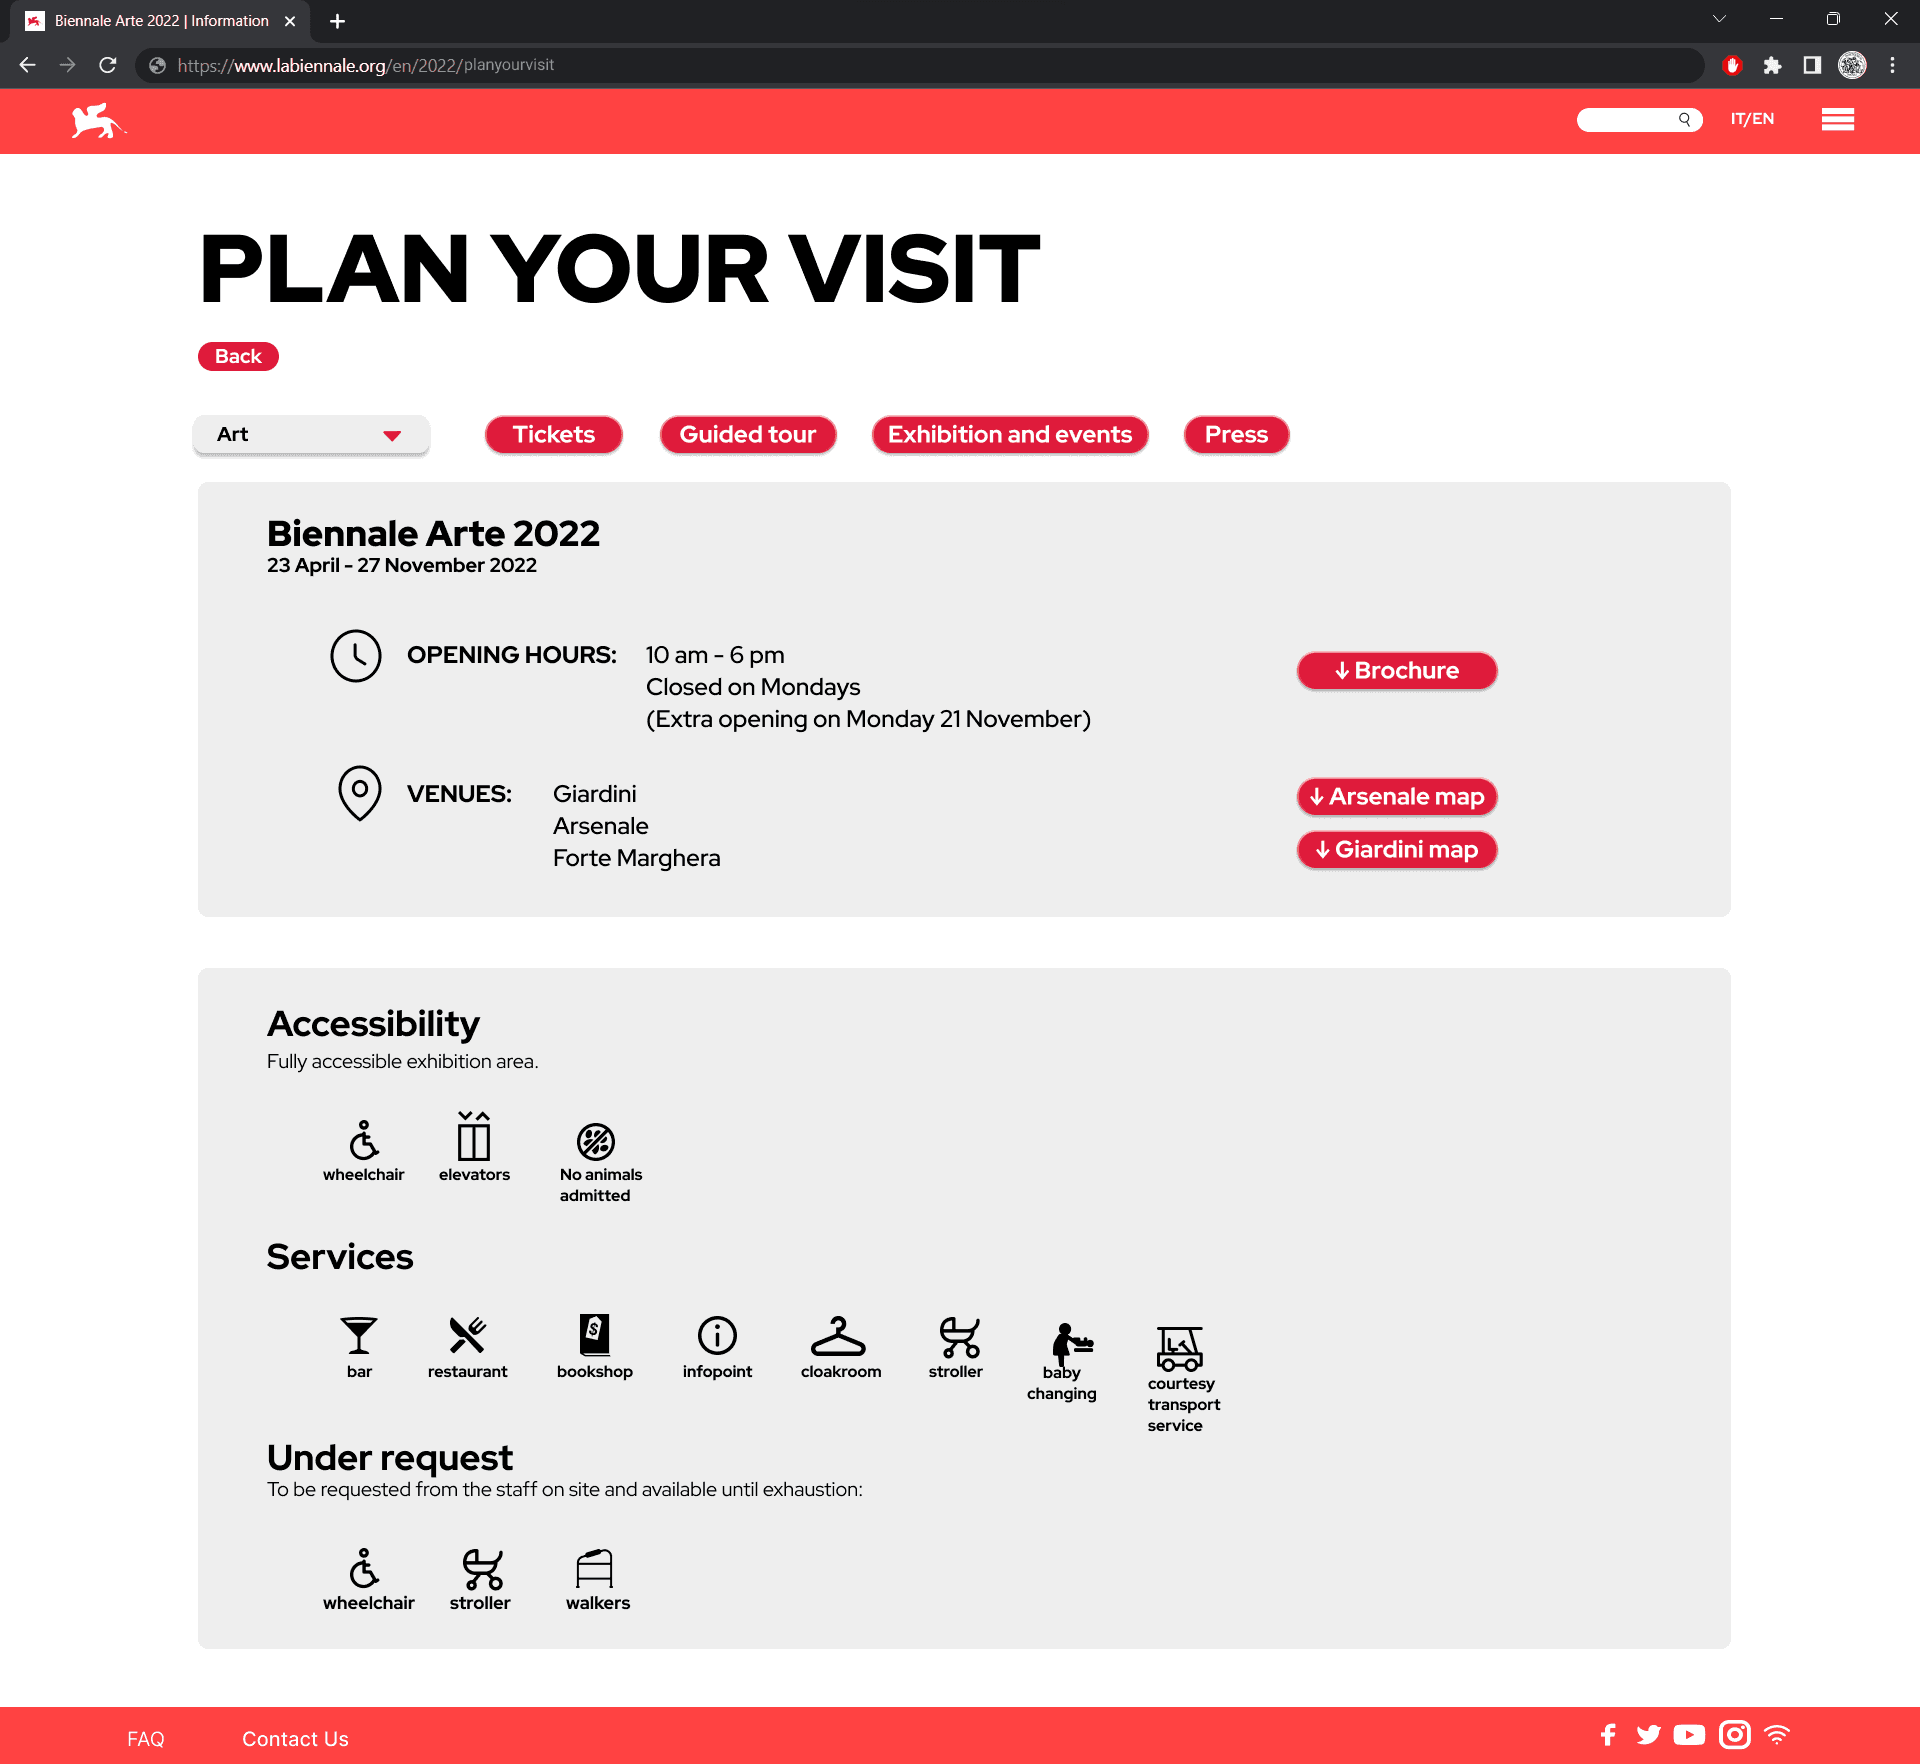
The Plan your visit page now serves as a comprehensive summary of all the necessary information to attend the Biennale. With a section filter, visitors can easily access specific details pertinent to each exhibition area.
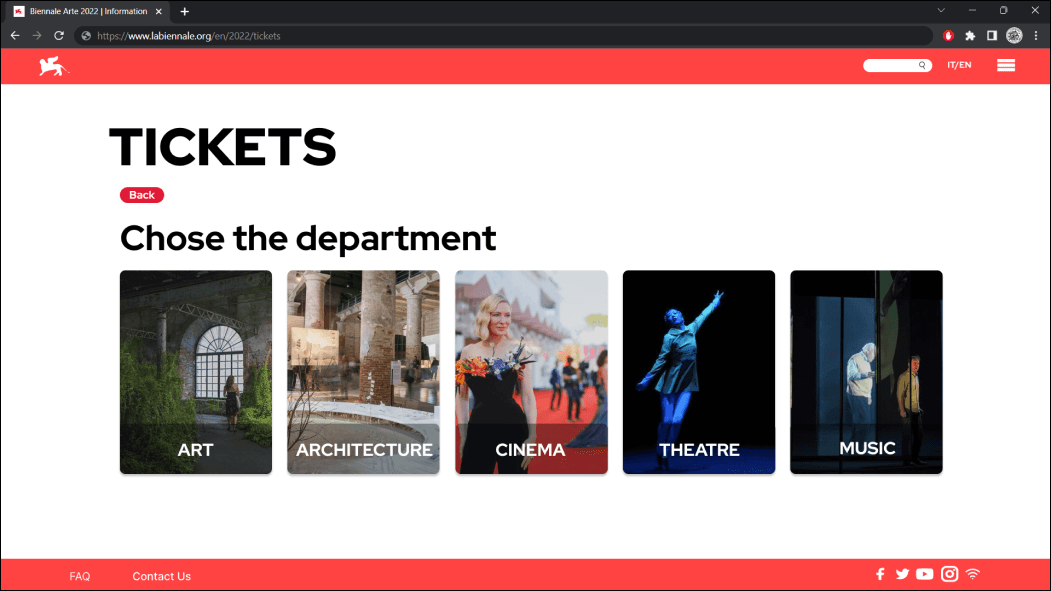
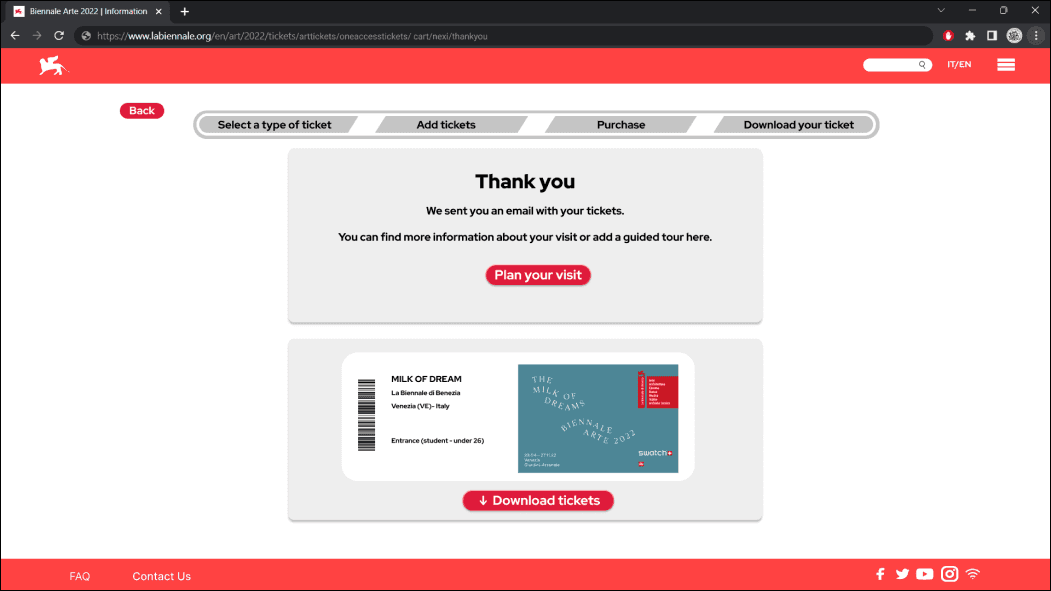
New pages have been added to the user flows to improve and streamline the experience. For example, a thank you page has been introduced, redirecting users to the Plan your visit section with all the necessary information and the option to download their ticket. In addition, a dedicated section has been created for all areas of the Biennale, ensuring that each of the five areas is highlighted and providing a more consistent and higher-quality user journey.
Home Page
Plan your visit page
Biennale Section Page
Thank you page
Design System
Visual Identity & Design System
Typography
Palette
DG1B3B
FF4242
C5C5C5
EEEEEE
CTA & Buttons
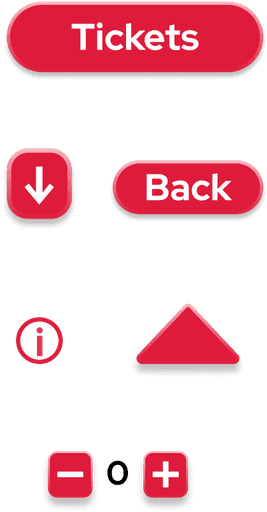
Filters
User Testing
Usability Test & Improvement chart
After finalizing the prototype, we conducted a usability test involving 8 potential users from diverse backgrounds. The test comprised three key stages: assigning tasks to the participants, observing their interactions with the prototype, and collecting feedback through a usability questionnaire.
The tester have to evaluate the new website through the System Usability Scale (SUS). And trhough the parameters we thith use for our graph.
We synthesized the feedback received and constructed a radar graphic featuring new parameters. Drawing from less favorable feedback, we implemented final enhancements to refine the project.
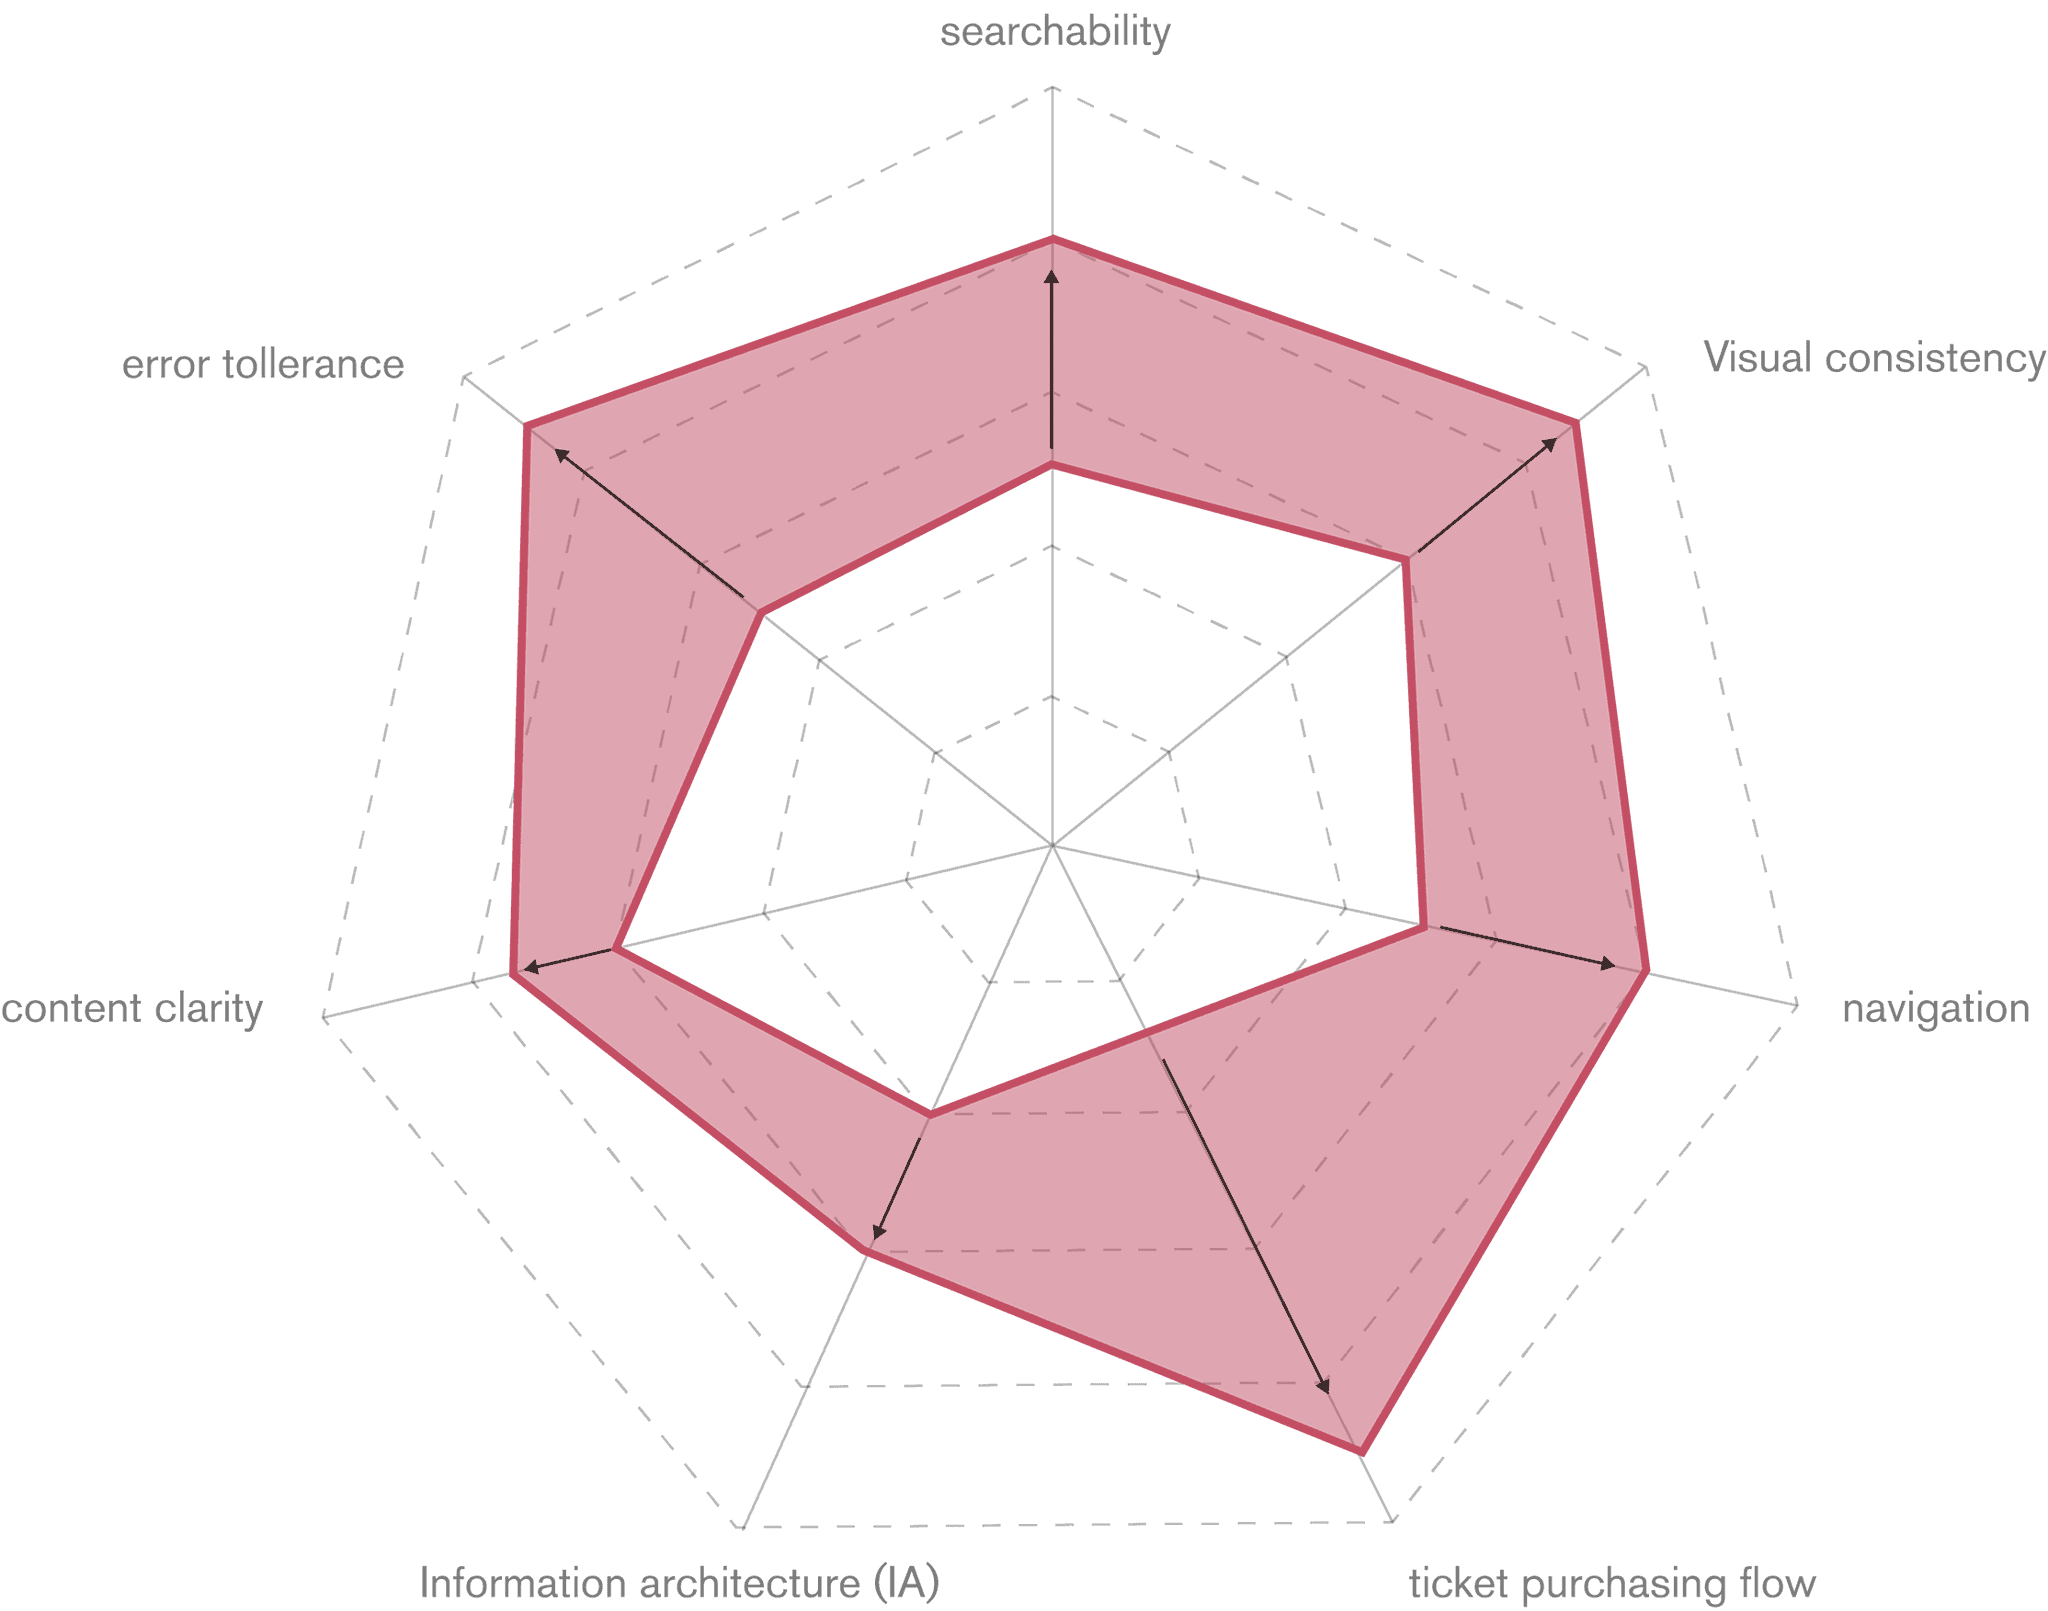
searchability: Easiness to find infos and sections in the website; Viasual Consistency: Consistency of the design style among the different pages of the website and app; Navigation: Easiness and clearness to navigate the website; Ticket purchasing flow: Easiness to complete the task; Information Architecture (IA): Organization of contents in categories and subcategories; Content quality: Quantity and quality of the contents; Error Tollerance: Easiness to solve errors or to avoid them.